Growing crane count sees Australia lead the charge in new commercial construction - Ray White Commercial
Contact
Growing crane count sees Australia lead the charge in new commercial construction - Ray White Commercial
Vanessa Rader, Head of Research for Ray White Commercial discusses Australia's current crane count and what what this means for commercial real estate.
Over the last few years we have seen some segments of the construction activity put on hold due to a combination of COVID-19 shutdowns, labour shortages, weather events and increased material costs all putting pressure on the building industry. This is most evident in the residential sector with new additions slow to be added to the market, resulting in population movements and low vacancy rates across the country, impacting affordability. For non-residential markets construction has continued to grow, rising to the highest number of cranes across the Australian skyline ever recorded.
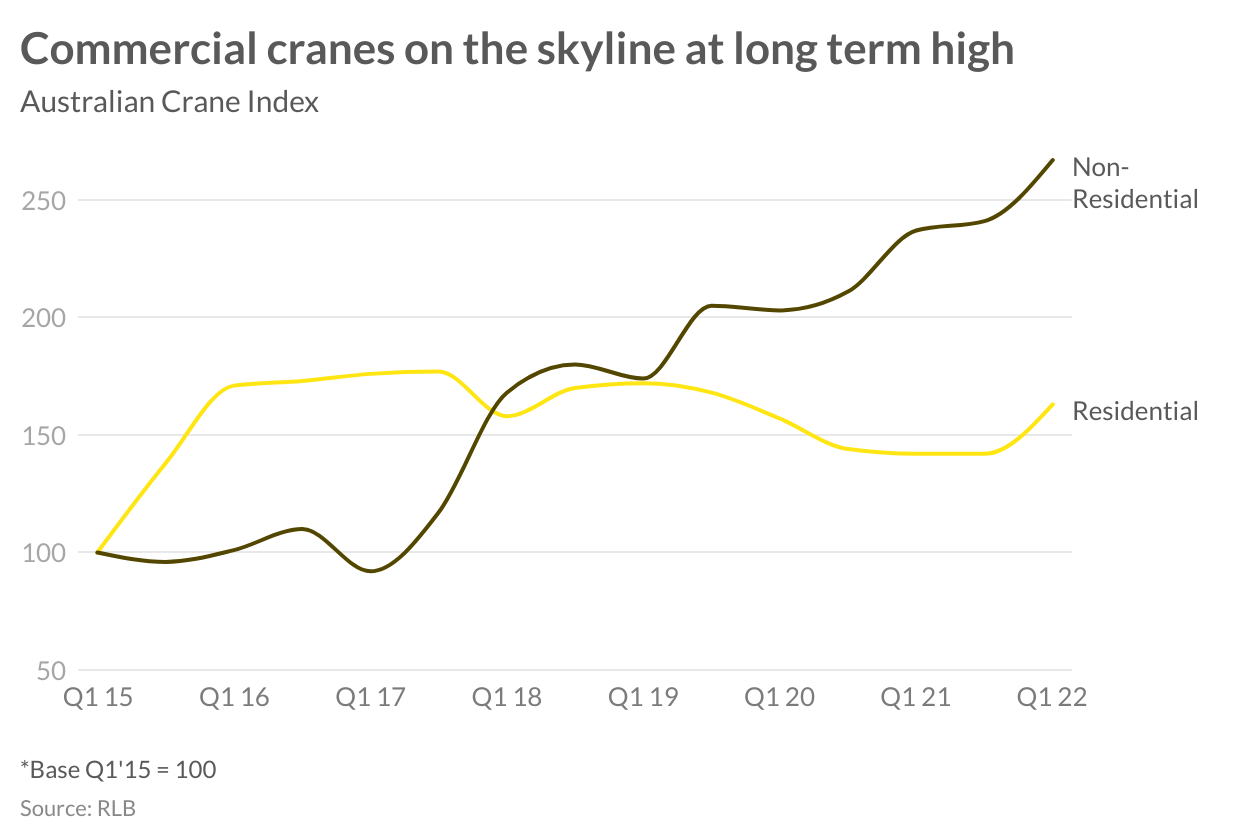
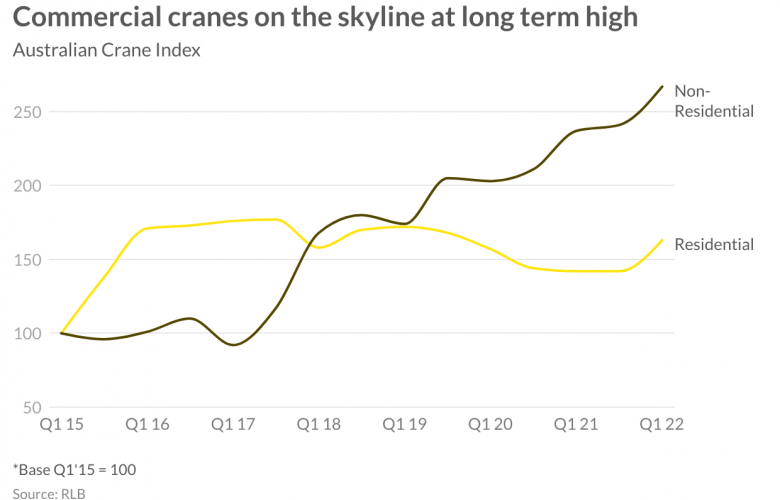
This year, we have seen some rebound for the residential development sector with Rider Levett Bucknall’s Crane Index highlighting the first increase in numbers since prior to the pandemic in early 2019. As at Q1 2022, there were 506 cranes on the Australian skyline, a net increase of 63 over the last six months for residential projects, Forty-one of these were in Sydney with gains also in Newcastle, Central Coast, Canberra, Melbourne, Perth and the south east Queensland markets of Gold Coast and Sunshine Coast.
For the non-residential sector, however, this has been a different story, while still road blocked by the same factors we have seen crane numbers increase each period since Q1 2020 with construction continuing albeit on an extended completion timeline. High-rise office construction has been a major contributor to the rising Crane Index for the non-residential sector, despite woes of rising office vacancies and the work from home model impacting physical office occupation.The standout sector has been mixed-use developments, together with medical and education, adding 32 cranes to the skyline nationally in the last six months.
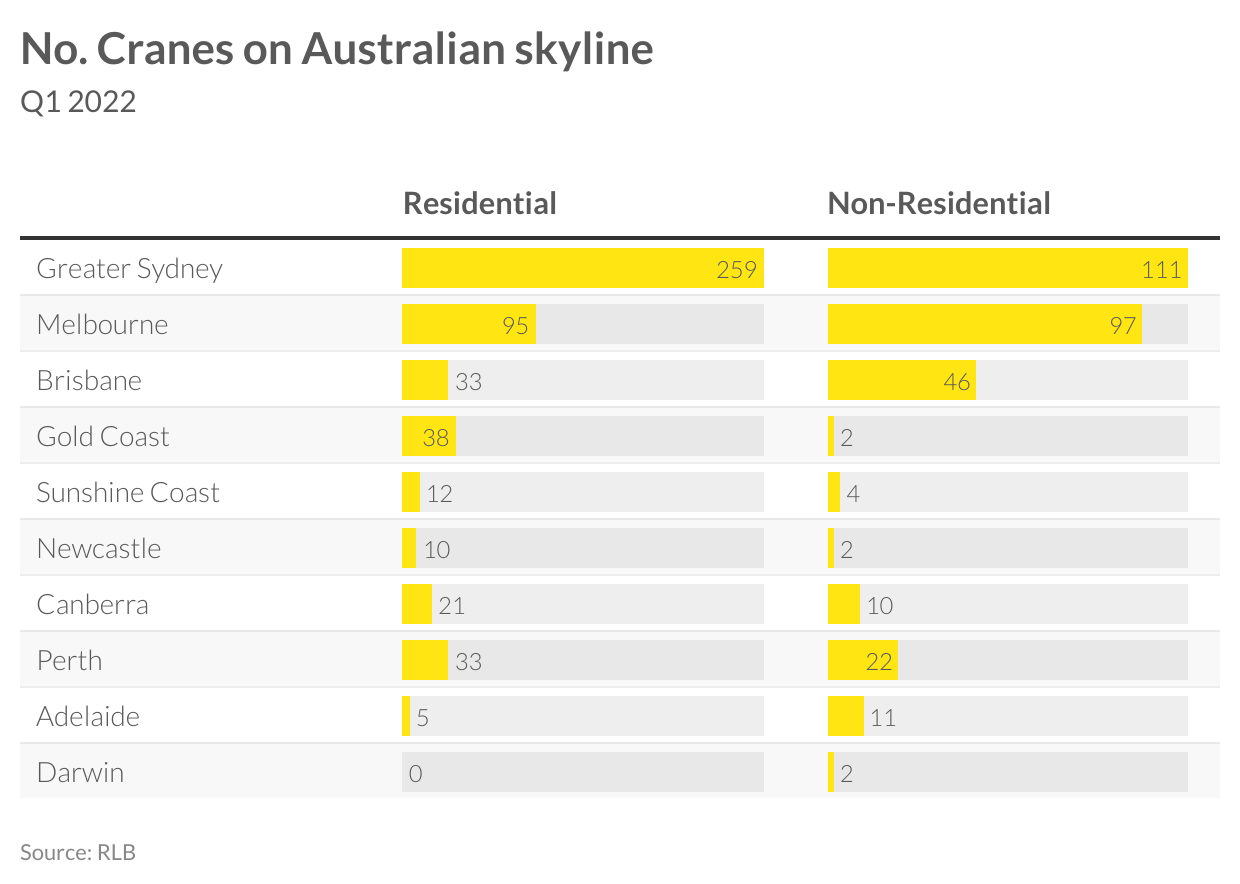
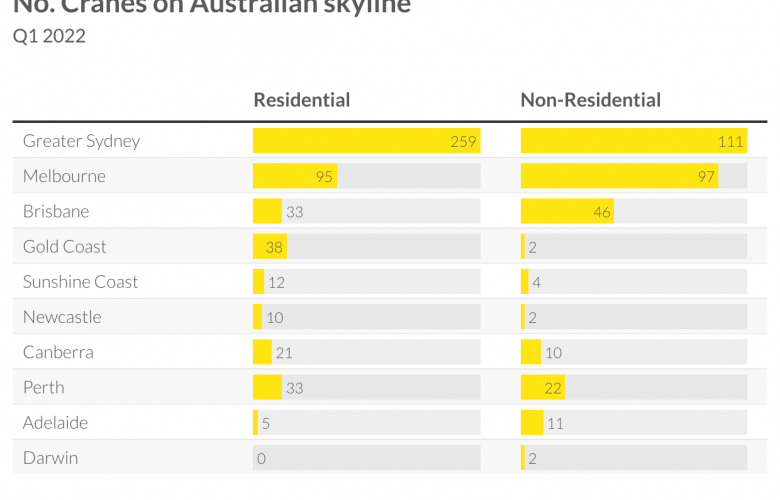
Looking at the major cities, we can see that Greater Sydney (including Central Coast and Wollongong) has the greatest number of active cranes at 370, this represents growth of 17 per cent over the last six months, with residential up 19 per cent and non-residential up by 11 per cent. The bulk of residential cranes are located in Sydney’s east and north with little change in the south and western precincts. In Perth there has been a rapid rise in activity, including 32 per cent more residential cranes active over the last six months, and an 83 per cent growth in non-residential due to increasing education, health as well as office projects. There has been small growth recorded in Brisbane non-residential cranes, up 5 per cent to 46 in the last six months due to the growth in infrastructure and civil projects.
Compared to other parts of the world, Australia is leading the crane count, with the USA and Canada only adding 22 cranes to their skylines over the same period. Markets such as Washington DC, Boston and Portland all declined in activity while some small increases were recorded in New York, San Francisco, Chicago and Toronto, while no change in crane numbers was recorded for Los Angeles, Las Vegas, Seattle and Honolulu.
For these markets half of all cranes have been for residential projects with mixed-use, health and office making up the remainder. Looking to Asia, numbers from Q4 2021 show Hong Kong activity still up, however, only across the commercial markets, with residential crane numbers decreasing, resulting in a net increase of 26 or 17 per cent over the calendar year.

